Why are user/client/patient/customer requirements so difficult to handle?
Often, people don’t seem to know what they want, or know what they want but appear unable to put it into words. A lot of our work involves why this happens, and what you can do about it. The explanation is simple when you know it, and the methods you need are low cost and easy to learn. Our talks about this topic are based on real cases, often with life or death consequences, and real examples of how to handle the problem swiftly and easily.
The image below shows the framework we use to handle this problem; short, simple, and easy to remember.

What are we getting wrong?
Sometimes, you know that there’s something wrong, but you don’t know what it is. Often, knowing how best to represent the problem will show you where things are going wrong. The image below shows a common problem, which usually occurs when a system is trying to fit cases into two cleanly distinct categories (red box and white box) without any provision for handling cases that fall into a greyscale between them (the red-to-white shaded box in the middle). For instance, your process might be forcing people to describe themselves as either married or unmarried, with no other options offered. This will lead to failure demand, when people are not clearly in either category (e.g. part-way through a divorce) and they either complete the process in a way that causes trouble later, or go via the help desk, taking up staff time. By using a representation that shows the key issue visually, you can see where a simple change to your system can prevent many problems from arising in the first place.

Are we missing something?
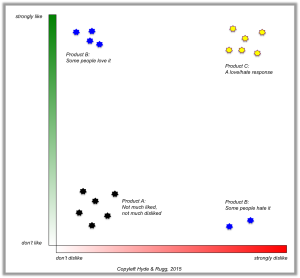
Sometimes, there doesn’t appear to be a problem, so nobody’s looking for better solutions. Often, though, there is something better waiting to be discovered. The image below shows an example. Usually, feedback on a product or service is on a single scale running from dislike to like. There’s nothing obviously wrong with that. However, if you instead ask for feedback about how much people dislike something, and also ask how much they like it, as a separate scale, then you get much richer insights, as shown below. There’s a big difference between people not caring either way about something (bottom left quadrant) and people simultaneously loving it in some ways while hating it in others (top right quadrant). However, both those responses would probably be lumped together if you used a single scale.

If something as obvious as this has gone un-noticed for years, what else might be waiting for you to discover? This talk is about how you can look systematically for things that everyone has missed.
We give talks about these and other related topics; we’re happy to talk with you about a talk to suit you.